When ABSOLUTE data are output by the ABSOLUTE.summarize module, there are several files:
- The *_summary.PP-calls_tab.txt file, which is a tab-delimited table detailing the called results, also known as the calls file.
- The *_summary.PP-modes.data.RData file, which contains all information used to generate the other output files and is also known as the modes file.
- The *_summary.PP-modes.plots.pdf file, which contains plots of all of the purity/ploidy modes; it is only produced if the plot modes parameter is set to TRUE.
- The *.ABSOLUTE_UNCALLED_PLOT.pdf file, which contains a plot for every uncalled result.
Two key output files for the manual analyst review are the plots PDF and the calls file.
Plots
The plots file shows the purity/ploidy plot, model scores, and candidate interpretations of the copy profile for the top three models for each sample.
|
Description |
Plot |
|
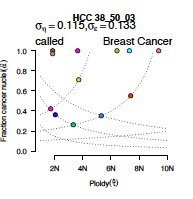
Purity/ploidy: This graph shows where the top 12 potential models plot in terms of fraction of cancer nuclei (purity) and cancer genome ploidy. Dotted lines denote potential solutions that share either b, the copy ratio associated with zero somatic copies (from upper left to lower right) or δν, the spacing between consecutive integer copy levels (from lower left to upper right). The colors in the model-based evaluation models match their representations on this graph. |
|
|
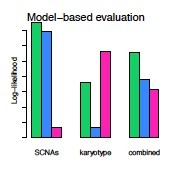
Model scores: This graph shows the model-based evaluation of the top 3 models. These represent the log-likelihood score of each solution in terms of the model fit of the observed copy ratios to integer absolute copy numbers and plausibility of the proposed karyotype. The higher-scoring solution (green) is identified by the combination of fit and karyotype log-likelihood values. |
|
|
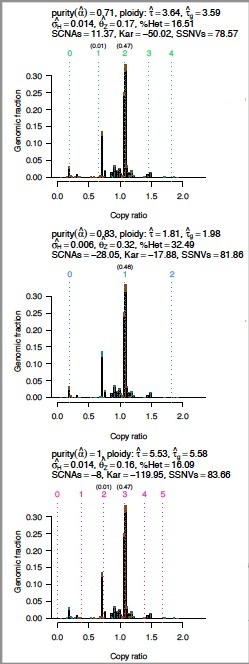
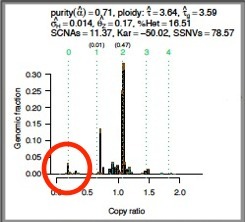
Candidate interpretations of copy profiles: These graphs show the interpretations of somatic DNA alterations on an absolute scale for the three most likely models. |
|
|
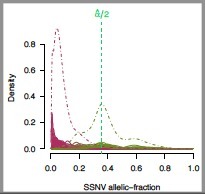
Allelic fractions may be reinterpreted as average allelic copies per cancer cell (multiplicity), potentially revealing subclonal point mutations. |
|
Calls File
The calls file is the output of the ABSOLUTE.summarize module, and is the file that the analyst will mark up to accept or override the solutions supplied by ABSOLUTE.
Create this annotation by:
- Opening the file in Excel or your favorite spreadsheet-editing application.
- Adding a column to the left side of the *_summary.PP-calls_tab.txt file from the ABSOLUTE.summarize module.
- To keep the default solution, leave the corresponding cell in the new column blank. To override the default solution, enter your selected solution number in the corresponding cell of the new column.
- Save the update as a tab-delimited text file.
Tips on Selecting Solutions
![]() Download the PowerPoint (PPTX) of example plots and model calls provided by the Broad Cancer Genome Analysis (CGA) group.
Download the PowerPoint (PPTX) of example plots and model calls provided by the Broad Cancer Genome Analysis (CGA) group.
Analysis of the data from ABSOLUTE is highly dependent on your data and your knowledge of your data. Here we outline some guidelines to help start. Keeping these concepts in mind, you should be able to figure out most of the reasons for the model calls in the examples provided in the linked slides above.
- Keep it simple. After considering all the model information, opt for the simplest solution.
If two models appear to be identical in terms of fit and other criteria, opt for the simpler, more likely one -- for instance, the mostly-normal genome number versus the doubled or tripled genome.
- Each copy number peak should be under an integral number.
The integral numbers reflect the state of the genome. 1=haploid, 2=diploid, 3=triploid, etc.
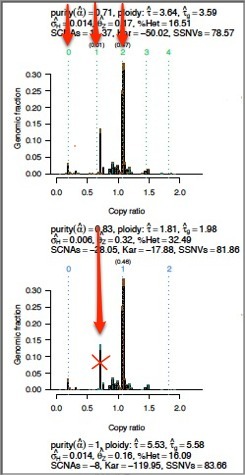
- The peaks should generally be at easy-to-get-to numbers (e.g., 1, 2, 4).
Triploid is harder to achieve than tetraploid, because doubling is easier than parts. This is not to say that triploidy doesn't happen, but in the interest of the simpler model, the tallest peaks should be at the easier-to-achieve numbers.
- The bottom peak for copy number should be close to zero.
Zero indicates an absence of copies, which is simpler than some middle number.
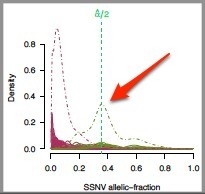
- The alpha/2 line for the SSNV allelic fraction plot should divide the peak representing the highest SSNV allelic fraction.